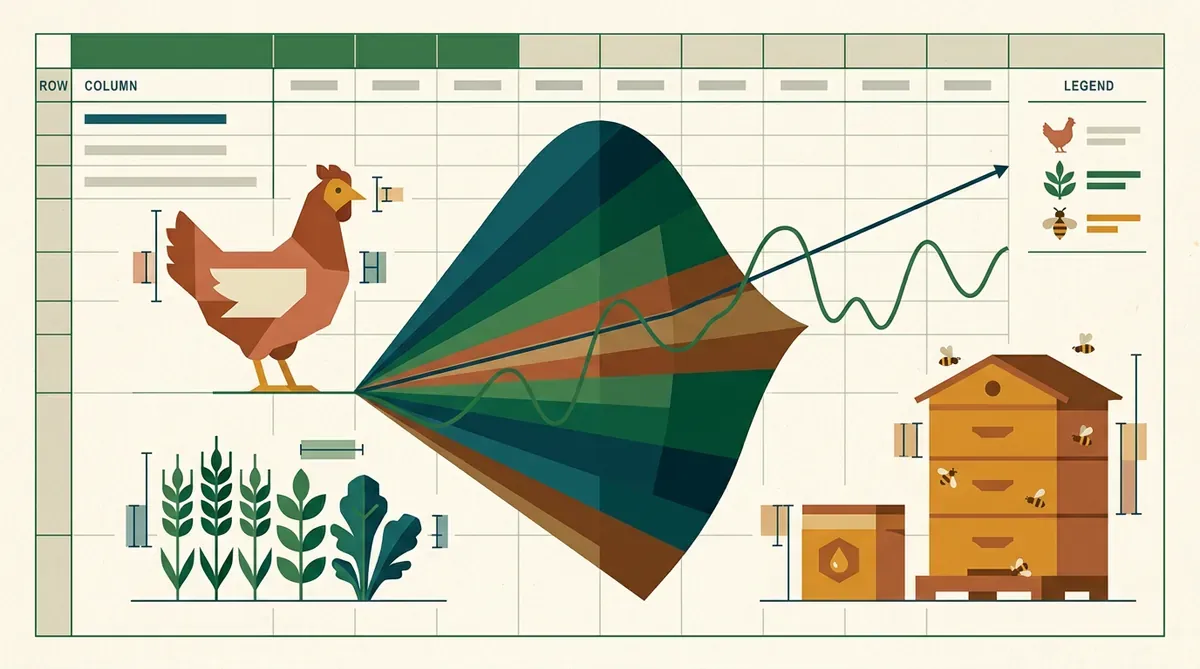
Modelo Financiero "Biológicamente Honesto" para Granjas Rurales
Descripción
Plantilla Excel/Python + guía de incertidumbre. El modelo financiero que uso para evaluar granjas rurales sin mentirle al Excel: incorpora mortalidad, estacionalidad y eventos climáticos.
Este producto aún no tiene un enlace de compra configurado.
Portal de Clientes (Odoo)
El procesamiento de pago, facturación y la gestión de tus descargas se realizan en nuestro espacio seguro de Odoo.
🔑 ¿Ya lo adquiriste? Inicia sesión aquí para descargarlo →La mayoría de modelos financieros para proyectos rurales asumen condiciones ideales: cero mortalidad, precio constante, clima estable. El resultado es una proyección que se ve hermosa en PowerPoint y se derrumba en el mes 4.
Este modelo toma un enfoque diferente: biológicamente honesto. Cada variable incorpora su incertidumbre real:
- Mortalidad por especie: Gallinas (8-15%), abejas (20-30% anual), peces (10-25% por ciclo). No como "riesgo" al final — como input directo en la proyección de ingresos.
- Estacionalidad de producción: Curvas reales de producción por mes (no "12 meses × producción promedio"). Incluye meses de cero producción por muda, sequía o veda.
- Eventos climáticos como variable: Probabilidad de helada, sequía prolongada o inundación según zona. El modelo simula 1,000 escenarios (Monte Carlo) y te dice: "en el 80% de los casos, tu flujo de caja es positivo desde el mes X".
- Secuencia de interdependencia: El orden en que construyes importa. El modelo calcula el costo de construir en el orden equivocado (ej: comprar gallinas antes de tener el galpón).
Incluye dos versiones: Excel (para quien quiere ver las celdas) y Python (para quien quiere correr 10,000 simulaciones en 30 segundos).
- Plantilla Excel con 12 hojas: inputs biológicos, proyección de ingresos, costos operativos, CAPEX por fase, flujo de caja mensual, punto de equilibrio, análisis de sensibilidad, Monte Carlo simplificado, comparación de escenarios, resumen ejecutivo
- Script Python (Jupyter Notebook): simulación Monte Carlo de 10,000 escenarios con distribuciones de probabilidad por variable, gráficos de distribución de flujo de caja y percentiles de riesgo
- Guía de incertidumbre (PDF, 18 páginas): cómo estimar cada parámetro biológico sin datos propios, fuentes de datos públicos (ICA, IDEAM, DANE), y cómo interpretar los resultados sin autoengaño
- 3 casos precargados: granja avícola peri-urbana (500 gallinas), apiario (20 colmenas), huerta mixta (2 hectáreas)
- Plantilla de "secuencia de construcción": ordena tus inversiones por dependencia biológica, no por deseo
- Video walkthrough (25 min): cómo llenar el modelo con los datos de TU proyecto específico
- Elige tu caso base: Abre el Excel y selecciona la hoja que más se parece a tu proyecto (avícola, apícola, huerta). Si es otro tipo, usa la hoja "Personalizado".
- Llena los inputs biológicos: Reemplaza los valores por defecto con tus datos reales o las estimaciones de la guía. Los campos en amarillo son obligatorios; los grises son opcionales.
- Ajusta la secuencia de construcción: En la hoja "CAPEX por fase", ordena tus inversiones según la dependencia biológica. La guía explica cómo determinar el orden correcto.
- Revisa el flujo de caja: La hoja "Flujo de caja" te muestra el escenario base. Busca el mes donde el acumulado se vuelve positivo — ese es tu horizonte mínimo de supervivencia.
- Corre el Monte Carlo (Python): Si quieres la distribución completa, abre el Notebook, ajusta los parámetros y ejecuta. En 30 segundos tendrás 10,000 escenarios con sus percentiles.
- Interpreta con honestidad: La guía tiene un capítulo sobre "cómo leer los resultados sin mentirte". Si el percentil 20 es negativo, tu proyecto tiene 20% de probabilidad de no funcionar. Eso no es pesimismo — es información.